
Announcing Graphora Compass: Graph-Native Intelligence for Tourism Operations
Tourism organizations are sitting on rich operational data, but most teams still make time-sensitive decisions with fragmented dashboards, manual reports, and delayed analysis.
At Graphora, we built Graphora Compass to fix that gap.
Compass is a graph-native intelligence platform designed for attractions, destination operators, and tourism boards that need to move from hindsight reporting to proactive response. It brings ticketing, operations, marketing, partner, and action-outcome signals into one connected decision layer, then turns that context into explainable recommendations and guided actions for non-technical teams.
Live demo: compass.demo.graphora.io
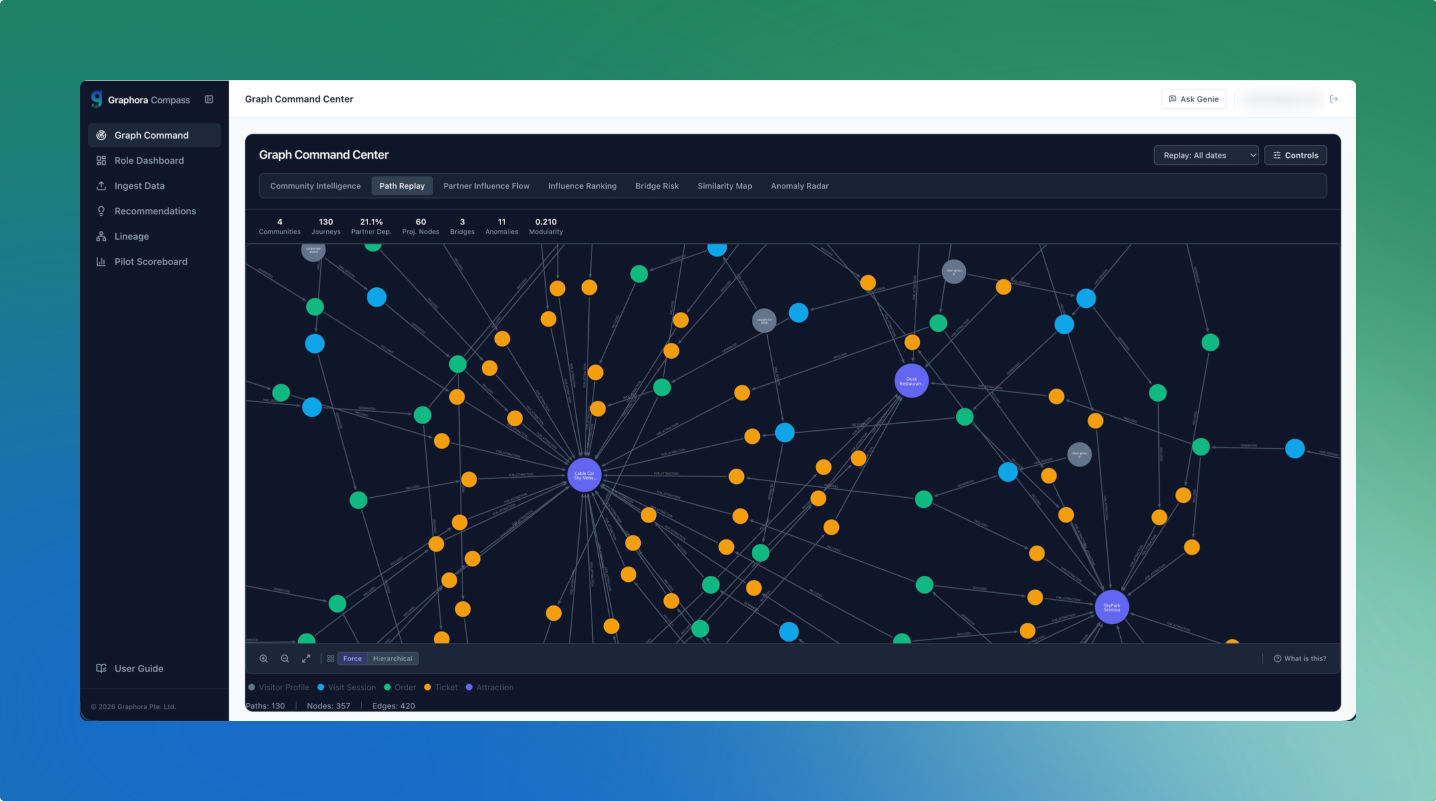 Graph Command Center: connected graph views for community, journey, partner flow, and risk lenses.
Why This Matters Now
Across tourism ecosystems, the same structural issues keep repeating:
- Demand shifts faster than reporting cycles.
- Operational and commercial data live in separate systems.
- Partner dependency risk is visible only after performance drops.
- Teams lack confidence in AI recommendations when evidence is unclear.
This creates a costly pattern: teams react late, optimize locally, and miss cross-functional signals that were already present in the data.
Tourism boards and operators need a shared intelligence layer that can:
- surface near-real-time patterns,
- forecast likely stress points,
- recommend actions with traceable evidence,
- and support role-based execution without deep analytics training.
That is the problem Compass is built to solve.
What Graphora Compass Delivers
Graphora Compass is built around one principle: connected decisions need connected data.
Instead of flattening records into isolated BI views, Compass models tourism operations as a living graph of visitors, attractions, partners, bookings, orders, recommendations, and outcomes.
From that graph, the product provides:
-
Graph Command Center
Community intelligence, path replay, partner influence flow, influence ranking, bridge risk, similarity map, and anomaly radar. -
Role Dashboard
Ops, Marketing, and Revenue views with role-specific KPI prioritization. -
Operational Recommendations with Explainability
Action proposals such as dynamic pricing, targeted promos, partner rebalancing, or capacity smoothing, each with evidence paths and confidence context. -
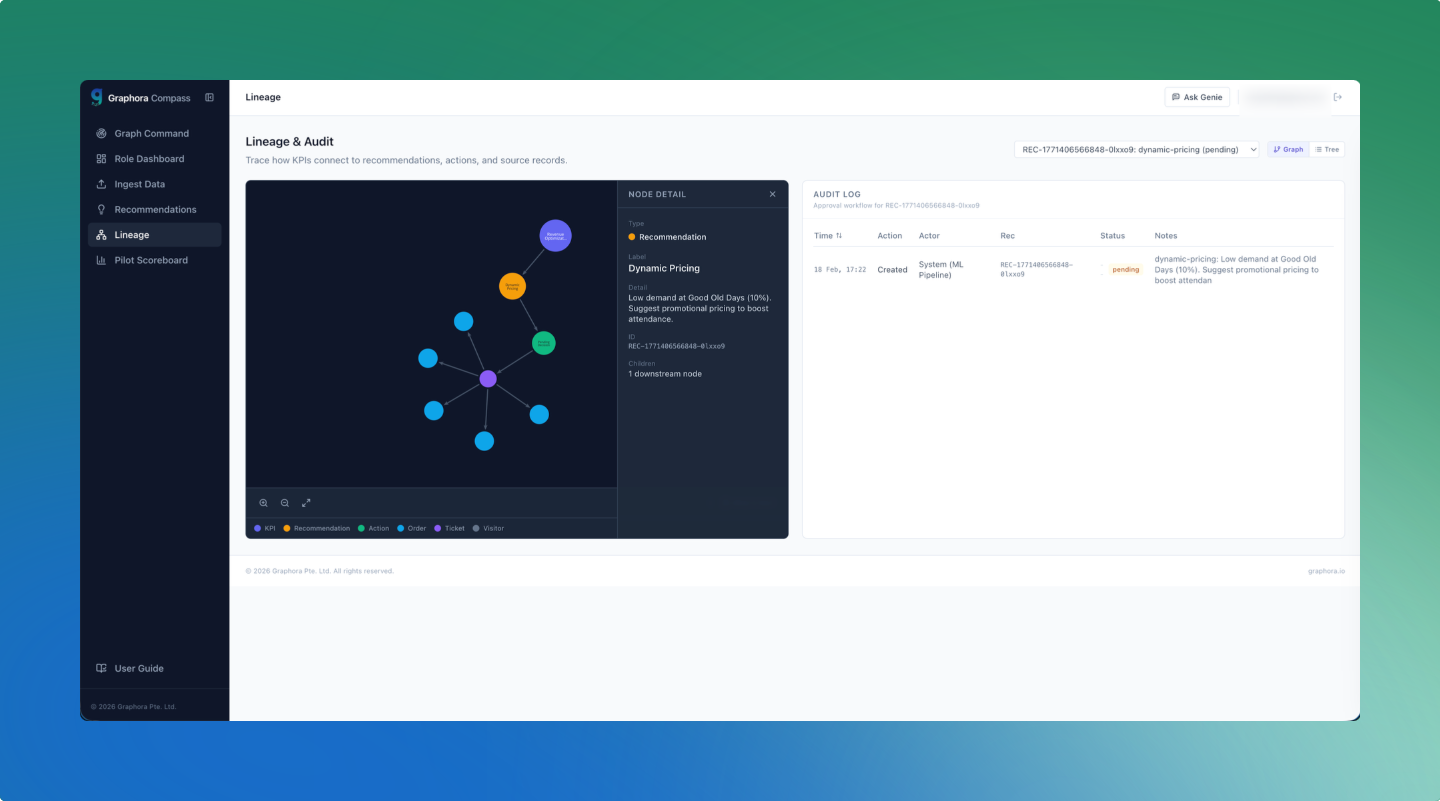
Decision Lineage and Auditability
End-to-end traceability from KPI movement to recommendation, action, and source records. -
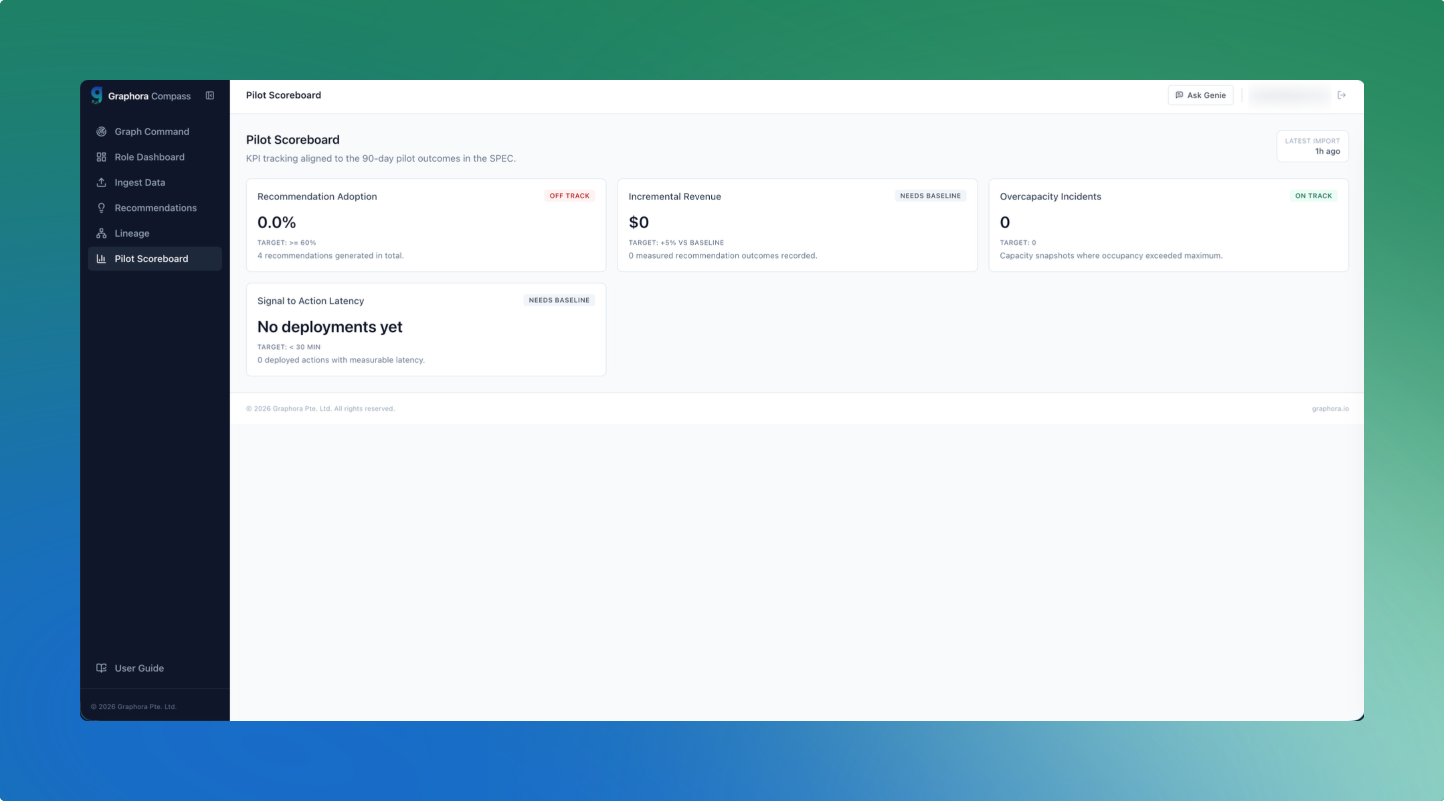
Pilot Scoreboard
Closed-loop measurement of adoption, latency, and impact to prove what actually worked. -
Contextual GraphRAG Assistant
A conversational interface grounded in current page context and graph state, so users can ask “what am I seeing?” and get chart-backed, evidence-linked answers.
Core Technical Architecture
Compass combines a production-minded architecture with operator-friendly UX:
1) Unified Graph Data Model
Data from ticketing, bookings, orders, attraction capacity, partners, campaigns, and recommendations is ingested into Neo4j as connected entities and relationships.
This enables:
- path-aware analysis,
- community and bridge detection,
- cross-domain signal propagation,
- and richer causal hypotheses than siloed tables.
2) Graph Analytics + GDS Lenses
Compass computes influence, bridge risk, similarity, and anomaly lenses using graph topology and behavioral connectivity.
These lenses surface patterns that are usually invisible in flat dashboards, including:
- cross-community spillover risk,
- hidden dependency hubs,
- structurally important but low-volume nodes,
- and emerging outlier behavior.
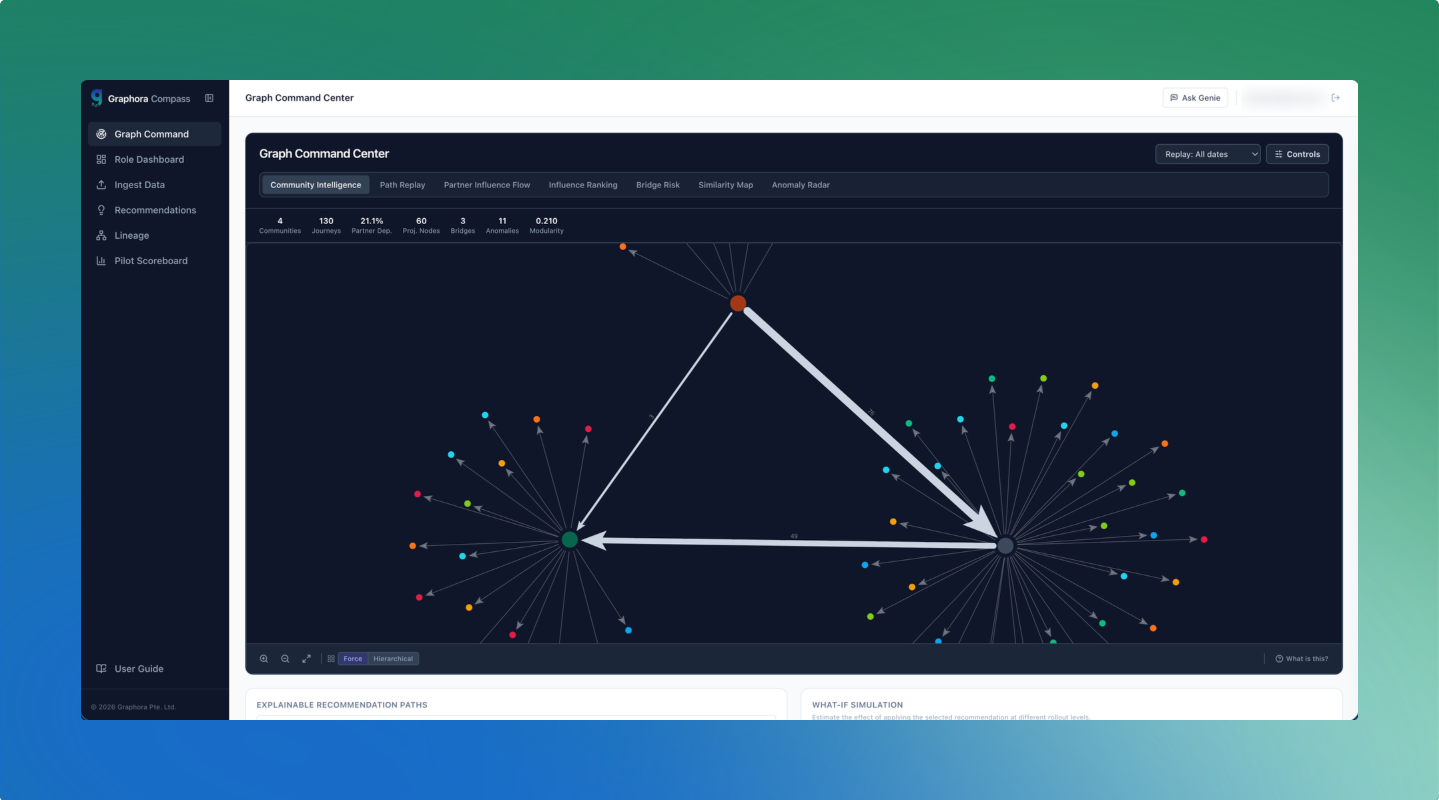 Community intelligence view: operators can see how clusters form, where volume sits, and where spillovers may propagate.
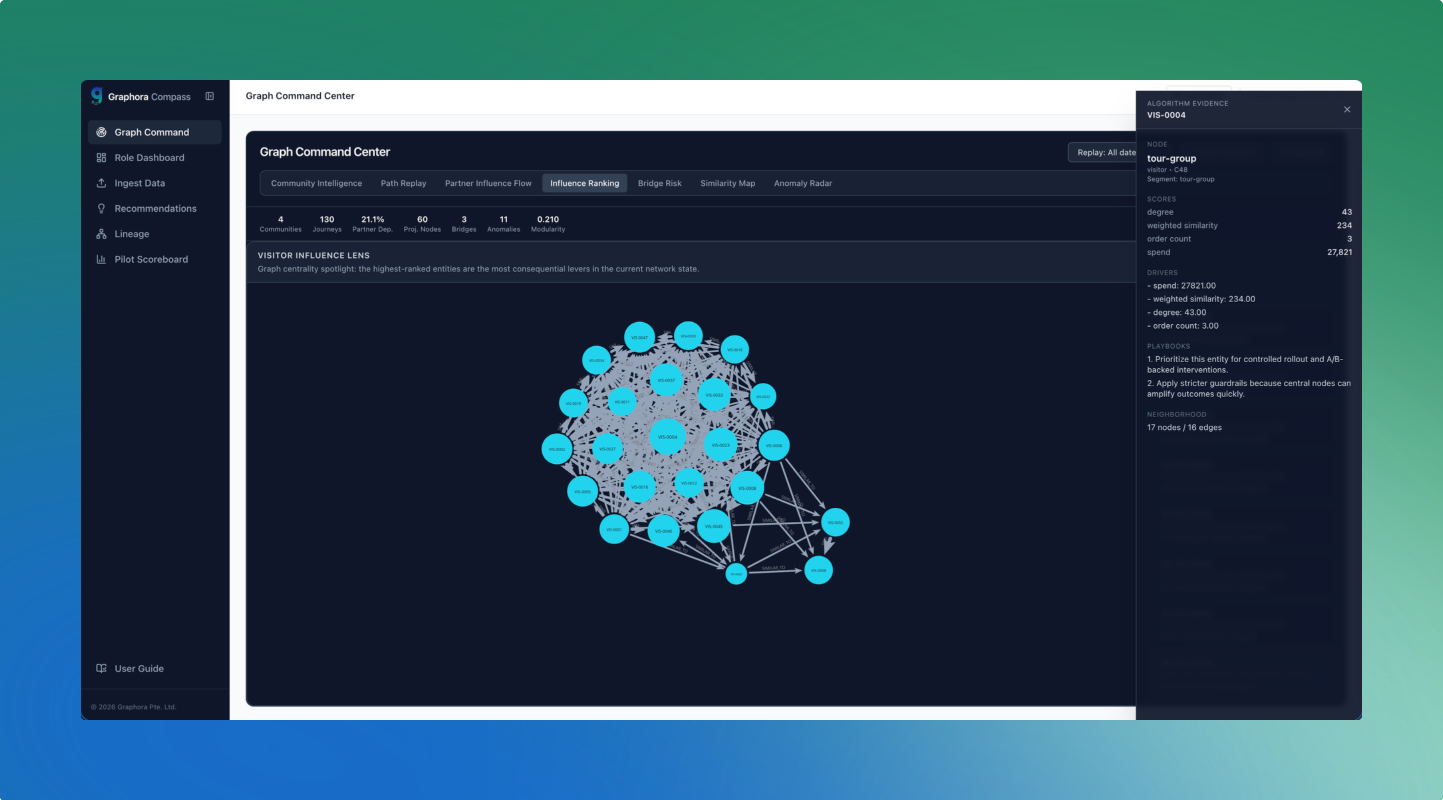 Lens mode with evidence drawer: moving from “interesting signal” to “action-ready context.”
3) Explainable Intelligence Workflow
Recommendations are not black boxes. Each recommendation is accompanied by:
- rationale,
- evidence chain,
- confidence score,
- projected impact,
- and simulation outcomes under adoption scenarios.
This is critical for operational trust and governance.
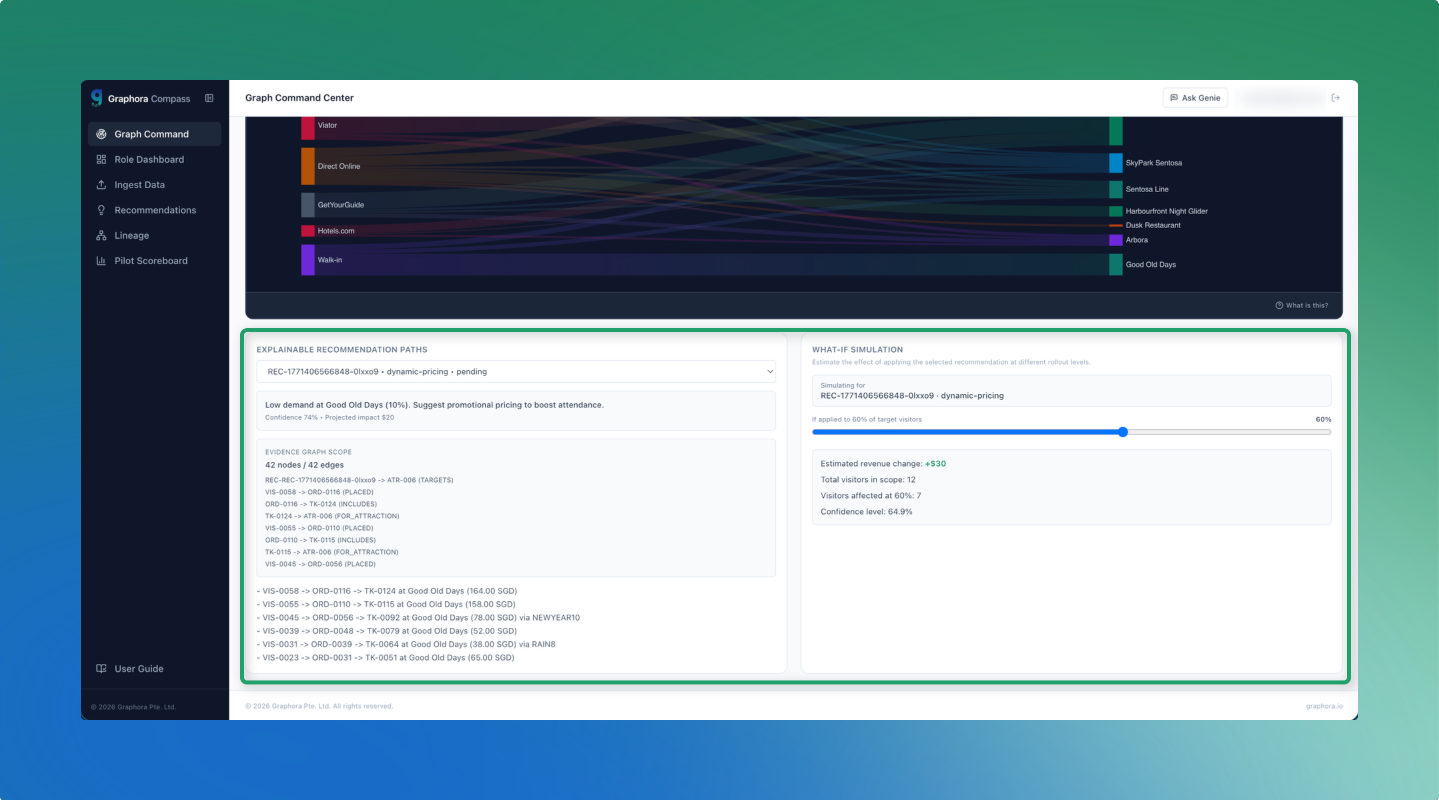 Decision workbench: recommendation context, explainability scope, and impact simulation in one operational flow.
4) Conversational GraphRAG (Contextual, Not Generic)
Compass now includes a real LLM-backed assistant using structured outputs and contextual memory.
The assistant:
- uses function-style routing to known Cypher templates when a query matches known intents,
- falls back to guarded text-to-Cypher generation when needed,
- enforces read-only query safety rules,
- returns structured responses with evidence and dynamic widgets,
- and carries short-term conversational context for follow-up questions.
The result is practical: a new-to-graph operator can click a graph view, ask what it means, and immediately get actionable interpretation tied to the exact context on screen.
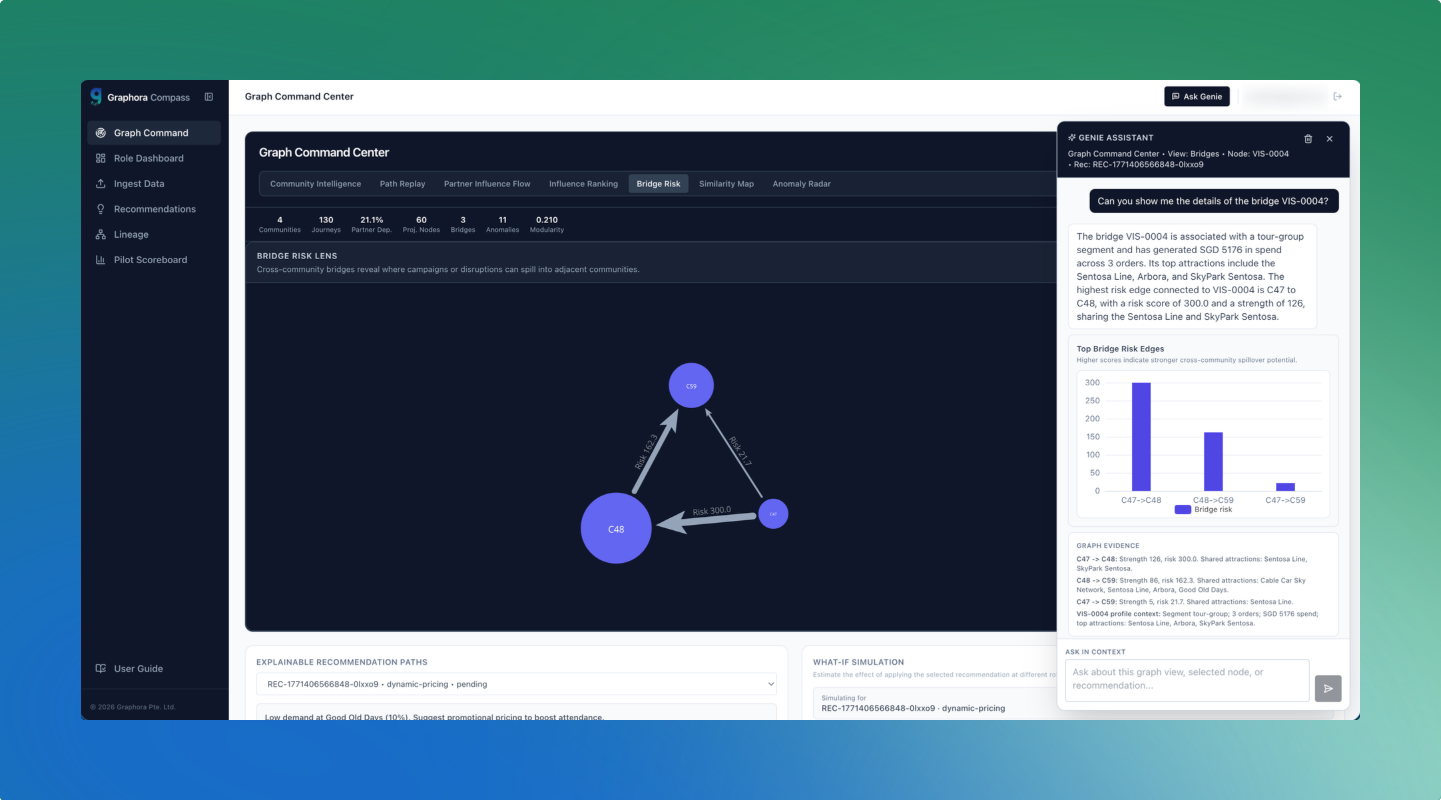 GraphRAG assistant: contextual Q&A grounded in the exact graph view, selected node, filters, and recommendation state.
Business Impact for Tourism Boards and Operators
For tourism boards across regions, Compass supports a step-change in operational posture:
Faster Response to Demand Volatility
- Detect early crowding pressure and queue risk.
- Trigger pre-emptive interventions before service degradation.
- Balance load across attractions and partner channels.
Better Commercial Decisions with Less Friction
- Use dynamic pricing and promotions based on connected demand signals.
- Identify where partner concentration creates downside risk.
- Prioritize interventions with clear confidence and expected uplift.
Shared Decision Context Across Teams
- Ops, marketing, and revenue teams work from one connected narrative.
- Decisions become easier to defend because evidence is explicit.
- Leadership gets both speed and accountability.
Improved Institutional Learning
- Track which recommendations were adopted, deployed, and measured.
- Quantify impact and latency from signal to action.
- Feed outcomes back into future decision cycles.
In short: Compass helps tourism organizations move from “reporting what happened” to “anticipating what happens next.”
Fit with the SG Tourism Accelerator Challenge
Compass is directly aligned to the Integrated Data Intelligence for Tourism Operations (Mount Faber Leisure Group) challenge:
- Integrated analytics: unifies insourced operational/commercial data with connected graph context.
- Near-real-time insighting: graph lenses and contextual queries surface live risk and opportunity patterns.
- Predictive and proactive operations: supports demand anticipation, capacity balancing, and guided interventions.
- Actionable recommendations: dynamic pricing, targeted promotions, and partner/channel optimization are first-class workflows.
- Usability for non-technical teams: role dashboards, explainability, guided UI, and contextual assistant reduce analysis friction.
This is not a static dashboard project and not a toy demo. It is a decision system designed for live operational use.
Product Walkthrough (Suggested Flow)
-
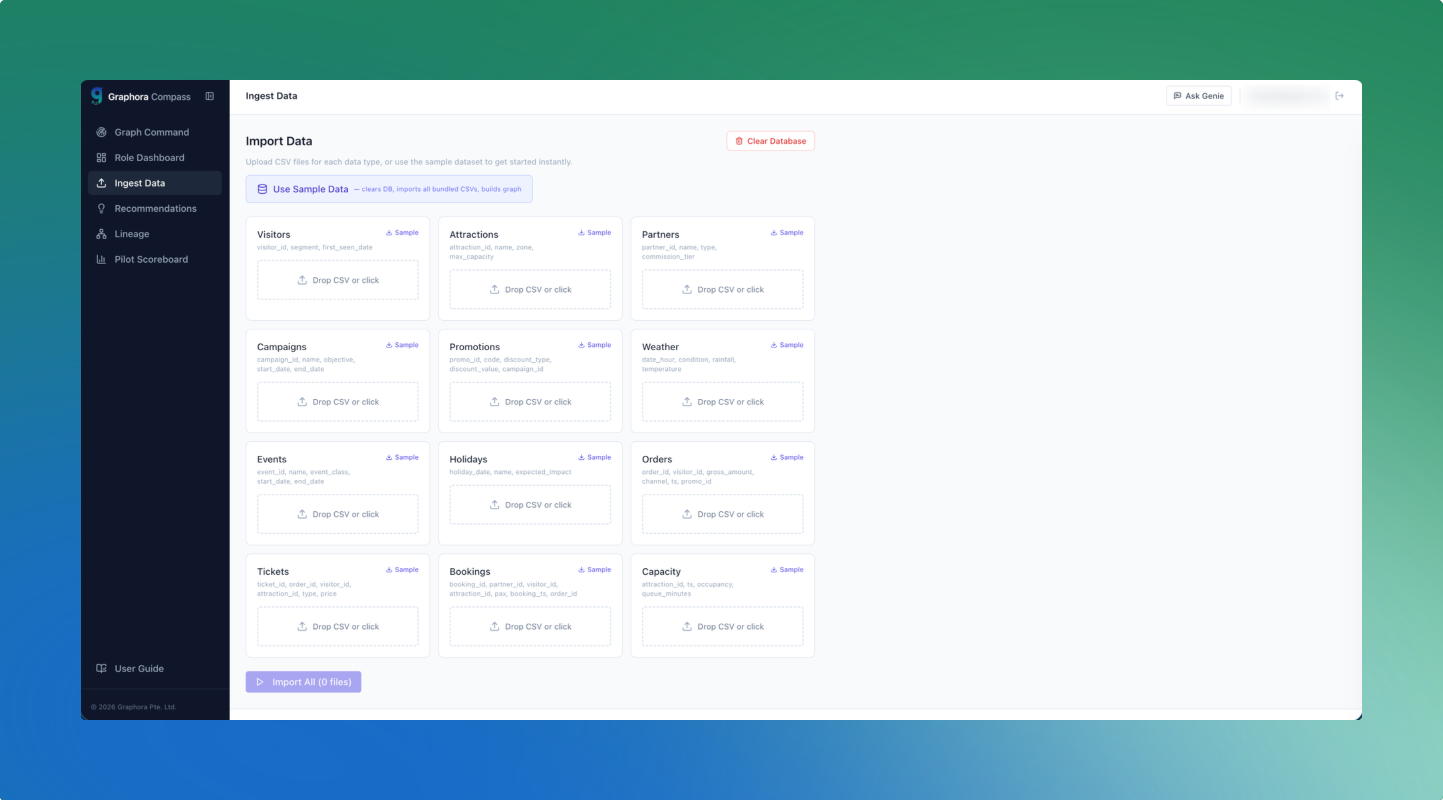
Start in Ingest Data to load source files and graph relationships.
-
Move to Graph Command Center to inspect communities, bridges, and anomalies.
-
Open Role Dashboard to prioritize by operational owner.
-
Validate actions in Recommendations with evidence and simulation.
-
Review causal trace in Lineage.
-
Monitor realized outcomes in Pilot Scoreboard.
-
Ask follow-up questions in the assistant at every step.
Live demo: compass.demo.graphora.io
What Comes Next
Our next focus areas include:
- stronger external market/industry data fusion,
- richer what-if simulation layers,
- multi-site benchmarking for tourism authorities,
- and executive scenario briefing modes for rapid incident response.
If you are a tourism board, attraction operator, or innovation team looking to operationalize connected intelligence, we would love to collaborate.
Graphora Compass
Graph-native intelligence for proactive tourism operations.
Demo: compass.demo.graphora.io